Optimizing Postgres SQL Query
Sep 06, 2024
HomeAs queries get more complicated, they tend to become slow and tedious. Couple things which have always helped me along the way.
Indexing columns
Never index columns with a lot of NULL values
Indexes can significantly speed up data retrieval. We should create appropriate indexes on columns that are frequently used in where, join, order by and group by clauses.
There are multiple ways one could create indexes in postgreSQL depending on their requirements. Some of the most common indexes include B-tree, Hash Index, Partial Index and Unique index.
- B-tree is most commonly used for comparison and range based queries.
- Hash is used for equality comparison, faster than b-tree.
- Partial Index are used to store custom filters as an index. One such example would be if you have a database which has 4 categories. You could create a partial index for all 4 categories. So the query would now use the index to query data instead.
- Unique Index is similar to primary key in a manner where it enforces unique values in the column with one important distinction. The unique index allows NULL values in the column whereas primary key does not.
When one is focused on performance, it is very important to keep in mind what kind of index would be the best for each column.
Having too many index may hinder the speed of write operation like
INSERT, UPDATEandDELETE.
EXPLAIN your Queries
Run EXPLAIN query;to figure out which part of the operation has incurred the most cost and to set a baseline benchmark. We’re first going to understand how to read the result of the query.
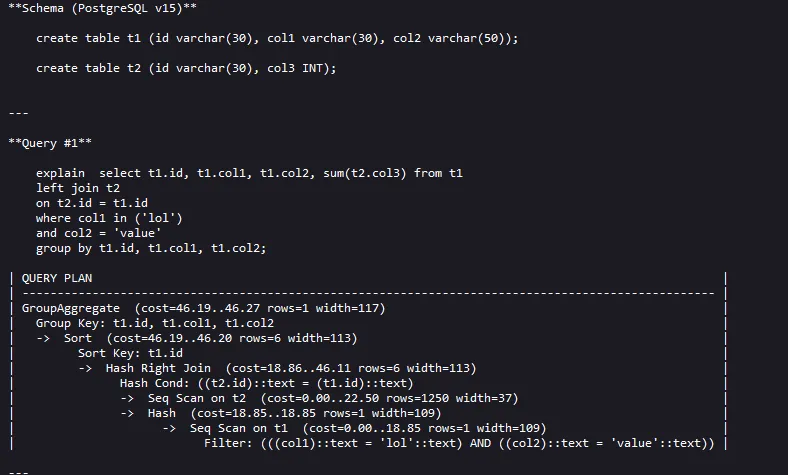
We’re gonna focus on the query plan. The query plan essentially determines the order of operations where the innermost operation is executed first. So to look at the cost of the entire query we would look at the first row of query plan which essentially is executed in the last (when the query is completed.)
GroupAggregate (Cost=46.19 .. 46.27 rows=1 width = 117)
Operation (Cost = Startup Cost .. Total Cost rows=x width=y)
We’re just gonna focus on the cost part in this article.
Cost has two values separated via .. the first number (46.19) also known as the startup cost is the cost at which this operation would begin working. To explain it in more detail we could say that up until the current operation we had already incurred an estimated cost of 46.19.
The second number (46.27) also know as the total cost is the cost at which the operation finishes. So to figure out how much time did that particular operation took you would do 46.27-46.19 = 0.08 units. Similarly if we compare all the operations within the query plan we notice that Hash Right Join operation has the most cost.
ANALYZE the table
Every query before executing creates a plan, these plan are create based on statistics of the table like number of rows, distribution of columns. Sometimes the statistics are inaccurate or outdated. Simply updating these statistics could potentially improve the query performance significantly.
ANALYZE table_name;
or if you want to analyze the entire database run
ANALYZE;
Keep in mind this command can take long time to execute depending on the size of the table/database.
You need to have
USAGEprivilege on the table to analyze it.
Limiting the number of columns/rows
Tables with billion of rows, no matter how much you optimize it would never be fast if you always fetch all the columns with insane number of rows.
One should always select the columns which are needed instead of
SELECT *
Queries with millions of rows could download data anywhere from 10Mb to 1Gb. This significanltly slows down the speed of execution. Instead try using pagination in Postgres with LIMITand OFFSET .
SELECT * FROM table_name
LIMIT 10 OFFSET 20;
In this example limit 10 means that the query will return at most 10 rows. offset 20 means that the query will start returning rows from the 21st row of the result set.
Offset starts from 0
Increasing work_mem
Each query is allotted some memory before executing the default memory allocated is 4Mb.
SHOW work_mem;
This means when we’re working with huge tables with millions of rows. The operations are offloaded onto the disk instead of in memory. One can check the query plan using EXPLAIN query; to check for such instances.
if that is indeed the case, you could consider increasing the work_mem for the session before executing the query.
SET work_mem=16Mb;
Possible units available are “kB”, “MB”, “GB” and “TB”.
work_mem will reset to default if you open a new session
RESET work_mem;